When debugging microservices, it can be challenging for developers to identify the root cause of issues. Not to mention how frustrating it is to search through endless logs across multiple services and the time it takes them.
With all these challenges, however, there is a silver lining — distributed tracing.
Distributed tracing can help your developers with tracking requests across services (but more on that later).
Let’s dive into what is distributed tracing, its benefits, and the role it plays in your teams’ system. Then we’ll cover which tools developers can use to implement distributed tracing in a cloud native environment.
But first, to understand where tracing fits in your microservices debugging process and why you might even need them in the first place, let’s identify the challenges that debugging with logs pose.
Log Debugging Challenges
Logs can be very useful when we are trying to understand an unexpected response or a production failure. However, logs don’t have unlimited capabilities. Here are some of the challenges they pose for your developers when they are debugging microservices:
1. Logging Is a Manual Time-Consuming Process
Adding logs is not an automatic process, and it requires a lot of meticulous, manual work. Identifying all the potential information that will be needed for debugging, adding the logs, removing them if necessary – these all take a long time and require a lot of effort. Also, the process is error-prone. Developers might be spending a lot of time adding logs but will still miss the exact information they need in production.
2. It’s Hard to Find the Right Balance
Developers need to ensure they have enough logs for debugging, but not too many logs so that the code is too heavy and they waste too much time on adding and analyzing them. It’s hard to create this balance. If they haven’t logged enough information, they’ll miss data for debugging. If they logged too much, the process becomes resource-intensive and makes log analysis much more difficult.
3. Tracking Logs across Services Is Difficult
Tracking and analyzing log entries across multiple services, containers, and processes is challenging. The developer has to be able to make sense of the relationship between all the different logs, which requires understanding the code flow in different services and correlating them to logs. They have to go through the process of transforming raw text (logs) into visualization in their minds.
This takes a very, very long time.
Even companies that have added unique identifiers to their instrumentation to enable tracking have difficulties maintaining and updating them. Not to mention ensuring all developers are up to speed about their homegrown identifier conventions.
4. Logs Aren’t Standardized
Logs do not have a structured format, meaning that any developer can create messages and events according to their style. While this provides flexibility and freedom, it can be challenging and counter-productive for your team to try to understand someone else’s logs or to explain them.
Also, lack of standardization leaves more room for human error.
Log Debugging Fail
As a result, logs won’t always provide the required information to solve performance and regressions. There are many solutions out there that try to overcome these challenges. These include standardization conventions, best practices, analysis tools, and more. But, maybe we need to realize that logging has its limitations and that your team needs another solution for debugging microservices.
And that solution is tracing.
What Is Distributed Tracing?
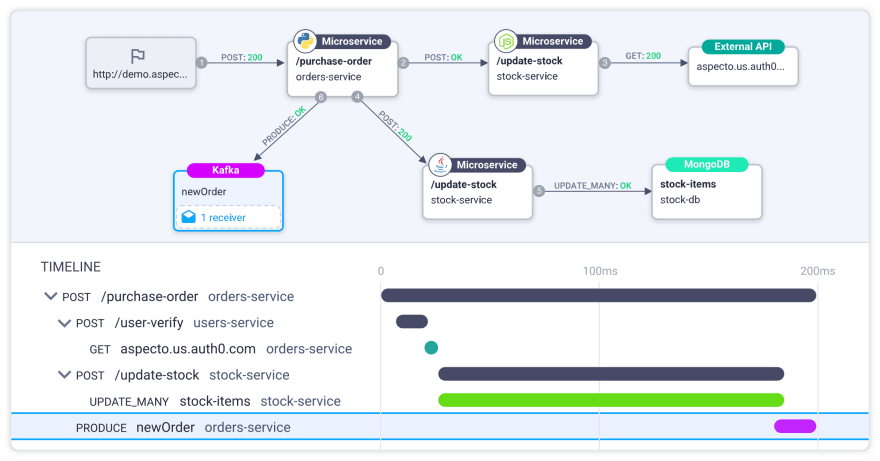
Traces complement logs. While logs provide information about what happened inside the service, distributed tracing tells you what happened between services/components and their relationships. This is extremely important for microservices, where many issues are caused due to the failed integration between components.
Also, logs are a manual developer tool and can be used for any level of activity – a specific low-level detail, or a high-level action. This is also why there are many logging best practices available for developers to learn from. On the other hand, traces are generated automatically, providing the most complete understanding of the architecture.
Distributed tracing is tracing that is adapted to a microservices architecture. Distributed tracing is designed to enable request tracking across autonomous services and modules, providing observability into cloud native systems.
Distributed Tracing Advantages
Where logging is bounded, distributed tracing thrives. Let’s see how distributed tracing answers logging limitations when it comes to debugging microservices.
1. Visualization
Traces are visual instrumentation. As opposed to text logs, with traces, developers don’t have to imagine the communication flows and make up an image in their minds. Instead, they can see it right before their eyes. This makes it easier for developers to understand the relationships between services and to resolve issues, like performance bottlenecks.
2. Automation
Unlike logs, traces are automatic. Developers don’t have to make the manual effort of adding logs to get the complete picture. Instead, they automatically get a visualization of what happened. This also solved the standardization problem. With automated traces, the standardization is hard-coded in.
3. Accelerate Time-to-Market
Distributed tracing provides observability and a clear picture of the services. This improves productivity because it enables developers to spend less time trying to locate errors and debugging them, as the answers are more clearly presented to them. As a result, productivity is increased, and developers can spend more time developing features, (or taking a break), while you accelerate time-to-market.
4. Tracking Requests Across Services
Microservices interactions span multiple services. Distributed tracing enables understanding the system and the relationships between components. This is done by tracking and recording all these requests through unique IDs that are passed to the services handling them. As a result, developers can see the flow and progression of the request across the entire architecture, which is often the hardest to understand when debugging. Your team’s code quality will improve immensely.
5. Easy to Use and Implement
With the right setup, developers can work with multiple applications and across different programming languages. This is unique for distributed tracing and saves your team a lot of time and headaches, by not restricting you to one language or certain apps.
6. Insightful
Distributed tracing provides the developer with a lot of insightful information. This includes request time, information about components, latency, application health, and more. All this info can be useful when debugging and during root cause analysis, for improving code quality and resolving customer issues quickly.
When Should We Use Distributed Tracing?
Great question! Here are the three main use cases in which distributed tracing can be helpful for you and your team.
1. For a Distributed-Application Architecture
If your department is using a distributed infrastructure, we highly recommend implementing distributed tracing. As you can see, this is the best method for tracking requests across services, with many teams involved and when you have complex processes in place.
It makes sure you don’t waste your time trying to investigate issues across machines or, search through endless logs.
2. When You Don’t Know Which Problem to Look for
One of the reasons developers end up with too many logs is that they want to cover themselves and make sure they have information for all and any scenario that could go wrong. But that’s the wrong approach. This is exactly what traces are for. Traces provide you with all the heaps of information you need to analyze yourself, without the disadvantages of logs. So if you don’t know what the problem is, you can analyze until you do.
3. When You Need Observability
Distributed traces provide you with visibility into the system and across all services and the relationships between them. You can see the journey requests went through, how long they took, insights into system health, and more. You can use distributed tracing not only for identifying why a problem occurred, but also to avoid problems with ongoing observability and tracking.
Distributed Tracing Tools
Hopefully, by now you’re convinced that distributed tracing can make your life easier, or at least shorten your debugging time. To get you started, here are three tools for your team to look into. These tools use an open-source called OpenTelemetry, an observability framework for microservices and a member of the Cloud Native Computing Foundation.
Here are the tracing tools that will complement your logging efforts, especially in a microservices architecture:
1. Jaeger
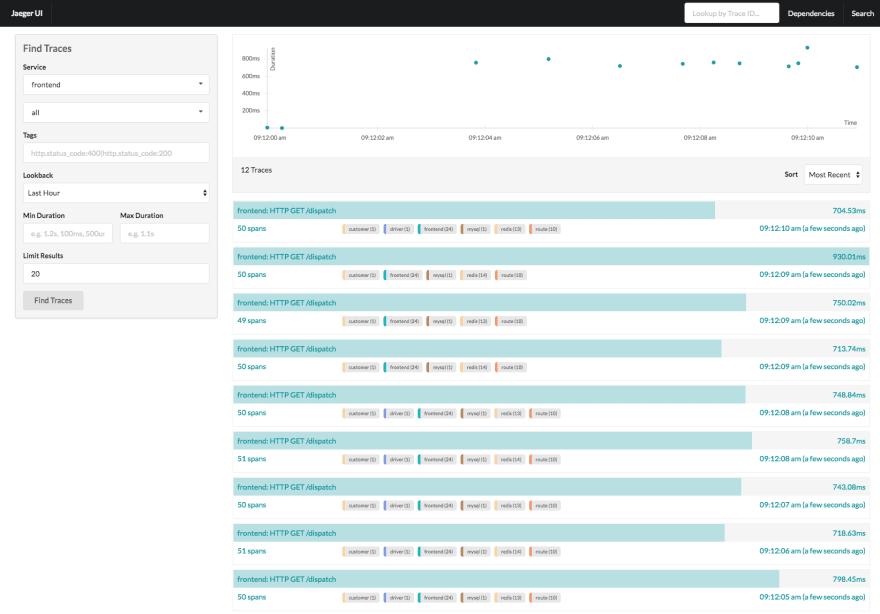
Jaeger is an open-source, distributed tracing tool. It enables transaction monitoring, latency optimization, and advanced data analysis. Jaeger supports most common languages and requires running Kubernetes. You can check it out here.
2. Zipkin
Zipkin, an open-source tool very similar to Jaeger, and also provides all distributed tracing capabilities. For implementation, Zipkin doesn’t require containers. You can use Docker, but you don’t have to. The difference between the two is minor, and in the end, it comes to personal preferences and specific technology stack needs.
3. Aspecto
Aspecto is like the Chrome DevTools for your distributed applications, helping developers find, fix, and prevent distributed application issues across the entire development cycle. Starting with their local dev environment all the way to production.
Aspecto is OpenTelemetry based, and the way it allows developers to prevent issues before they reach production is by implementing telemetry data that learns the system, then compares what they do locally to the production, staging, or other locals baseline data.
This helps you to validate changes and prevent issues, live, while you develop.
It’s super easy to install with a one-liner SDK, and you can give the Live Playground a spin.
Conclusion
Debugging with logs can only get you so far. By implementing distributed tracing, you can see your requests and services, and spend less time debugging. Try distributed tracing with an open-source tool, like Jaeger or Zipkin and if you’re looking for that extra boost of predicting the effects of your changes, give Aspecto a try, for faster feedback and more visibility.


Top comments (2)
Nicely written , I tried Zipkin with Spring Boot 2.X but no success.
Found the tutorials on Zipkin with Spring Boot 1.X only. Do you have some references?
A related concept to know is Log Level per Request: devopedia.org/log-level-per-request